|
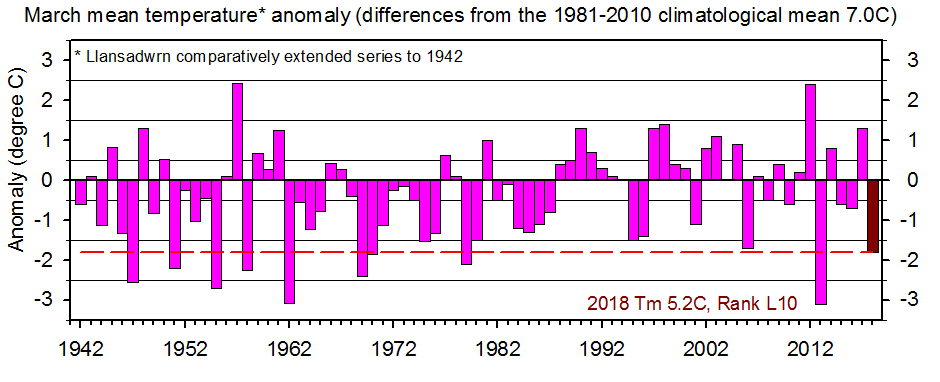
Three quite wet days and briefly cold in the first half of the month Rainfall of 121.8 mm (114%) & [120%] of averages was largest since 2016 ranking 34th in 90-years of Llansadwrn records. The wettest day was on the 14th with 23.2 mm while the 2nd had 14.0 mm and te 17th 12.8 mm. There were 6 (-3.2) dry days (<0.2 mm) and 3 (-1.8) of these had no precipitation. Rain days (>=0.2 mm) were 25 (+3.2) and wet days (>=1.0 mm). Days with 5 mm, or more, were 8 (+0.2). Rainfall duration (wet hours) totalled 121 hours. A little drier at Gorwel Heights with 92.4 mm [81%] of average with the wettest day 10.4 mm on the 23rd. There were 7 dry days; 24 rain days; 21 wet days; and 9 had 5 mm, or more. Rainfall duration was 127 hours. The mean temperature in Llansadwrn was 5.5C (+0.2) & [+0.3] of averages lowest since 2015 rank 18th since before 1979. The mean maximum was 7.9C with the highest 11.8C was on the 28th; 6 days had maxima of 10C, or more. The mean minimum was 3.0C with the lowest -1.4C on the 9th. There were 4 air frosts and 16.2 h of frost. The lowest grass minimum was -7.2C on the 8th and there were 19 ground frosts. At Gorwel Heights the mean temperature was 6.2C [0.0] with the highest 13.3 on the 28th; 10 days had maxima of 10C, or more. The mean minimum was 3.9C with the lowest 0.8C on the 8th meaning there were no air frosts. There was no snow in Llansadwrn, but there were 8 days of small hail (+1.2) of average.
February 2018Temperatures below and rainfall close to averagesSpell of wintry weather at beginning and end of the month when much colder Temperatures all below average this month and lowest since 2010. The mean maximum was 6.9C (-1.5) and [-1.4] of averages. The highest maximum was 11.0C on the 19th, the only day in double digits, while the lowest maximum was 0.5C on the 28th, reached for a few minutes only on a day when the temperature was otherwise below zero. The mean minimum was 1.0C (-1.7) & [-1.2] of averages with the lowest -3.4C (-1.9) on the 28th and the highest 4.9C (-2.2) on the 19th. There were 10 (+5.2) days with air frost and 23 (+7.3) days with ground frost, lowest -7.6C on the 24th. At Gorwel Heights the mean temperature of 4.4C was [-1.5] of average. The highest maximum of 11.7C was on the 19th as was the highest minimum 5.8C. The lowest maximum was -0.6C on the 28th making it a rare ice day considering Llanfairfechan's microclimate. The lowest minimum was -4.3C also on the 28th. Gorwel Heights recorded 63.8 hours of frost while Llansadwrn had 94.7 hours. Sleet and snow fell on 7 (+3.7) days and various types of small hail on 8 (+2.7) days. Snow was lying on 2 mornings with 3 cm on the 27th and 1 cm remaining on the 28th. Gorwel Heights also recorded 3 cm of lying snow on the 27th. Precipitation was 76.7 mm (102%) & [98%] of averages, least since 2015 ranking 39th since 1928. The largest rainfalls were 19.1 mm on the 8th and 11.7 mm on the 9th that falling on saturated soil resulted in local flooding. There were 8 days (+2.5) with no precipitation; 11 (+0.7) dry days; 17 (-1.0) rain days; 13 (+1.2) wet days while the number of 5 falls of 5 mm, or more, were average. At Gorwel Heights precipitation was 44.4 mm [57%] of average. The largest fall was 9.0 mm on the 12th. There were 13 dry days; 15 raindays; 12 wet days; and 4 days when 5 mm, or more, fell. Rainfall duration was 69 hours and in Llansadwrn 89 hours
Winter 2016/17Rainfall total close to the averages; a little below the decadal (94%) and a little above the 30-y [104%] averages. Temperatures a little below averages
March 2018Temperatures well below averageVery cold at the beginning with another cold plunge mid month
Rainfall was 87.5 mm (110%) & [1.3%] of averages, lowest since 2016 and ranking 27th largest since 1928. The wettest day was on the 9th having 14.8 mm. There was 5 days (-3.3) with no precipitation and 10 dry days (-4.4). Rain days were 21 (+4.4) and wet days 16 (+3.0). There were 5 days (+1.5) that had 5 mm, or more. Rainfall duration was 90 hours. Rainfall at Gorwel Heights was larger this month having 102.4 mm [119%] of average. There were 10 dry days; 21 rain days; 17 wet days and 9 days had 5 mm, or more. Rainfall duration was 104 hours. In Llansadwrn snow fell on 6 days the 1-3rd, the 8th when there was 4 cm lying snow lying at 0900 GMT, the 17-18th with 2 cm snow lying on the 18th. Sunshine recorded at RAF Valley was 108.3 h (80%) & [96%] of averages, least since 2006 and ranking 30th lowest on the Anglesey record since 1931. The sunniest day was on the 20th with 9.8h and there were 6 sunless days.
April 2018Sometimes dull and wet, sometimes cold and sometimes warmA few warm summery days in the middle of the monthRainfall was 62.3 mm (80%) and [98%] of averages, most since 2016 and ranking 43rd largest since 1928. The wettest day was on the 24th having 15.8 mm and only 3 days reached 5 mm, or more, 3 below average. There were 8 (-2.2) days with no precipitation; 10 (-3.9) dry days; 20 (+3.9) rain days and 12 (+0.5) wet days. April is our driest month with only 8 years having over 100 mm. At Gorwel Heights, however, the deluge of 41.6 mm on the 1st of the month contributed largely to the 100.4 mm total [160%] of #average. Here there were 11 dry days, 19 rain days; 15 wet days and 4 had 5 mm, or more. Rainfall duration (wet hours) was 81h while in Llansadwrn duration was 88h. The mean temperature 9.4C was (+0.4) & [+0.5] of averages, highest since 2014 ranking 10th in station records since 1979. Maxima were generally on the low side, with the mean 12.8C on averages, except for a warmer spell 18-21st including 2 days of 20C, or more. The highest maxima were 22.6C on the 18th recorded in Llansadwrn and at Gorwel Heights exceeding Capel Curig 22.3C and equalling Porthmadog, and 22.8C at Gorddinog. Minima, helped by cloudy nights, were above average the 6.1C (+0.8) & [+1.2] highest since 2016 and ranking 6th highest in station records. There was no air frost although the lowest 0.3C (-0.7) on the 5th was a close call. There were 4 (-4.2) ground frosts with the lowest -4.0C on the 5th. A fairly dull month, particularly at the beginning with some sunless days. At Valley sunshine was 140.6h highest since 2016, but ranking 23rd lowest on the Anglesey record since 1931. The sunniest day was on the 30th with 13.4h which was also the brightest in Llansadwrn where global solar radiation was 24.50 MJ m -2. There were 4 sunless days in Llansadwrn and 3 at Valley.
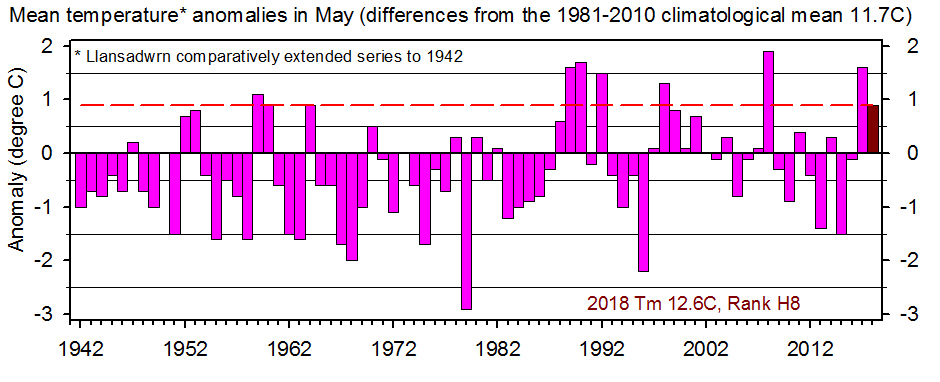
May 2018Drier and warmer than average UK and Wales sunniest for over 25-years, but not hereBegan cold, some very sunny days through the month, ended wet with thunderstormSunshine. Well there were some very sunny days that were most welcome, but at times it was cloudy and with coastal fog/ cloud at times. At RAF Valley sunshine was a respectable 231.6h, lowest since 2015, but 10th highest on the Anglesey record. The Mays of 2016 and 2017 are hard to beat having 250.8h and 250.6h respectively, and 2010 had 271.9h. So we must not grumble with just two sunless days at Valley on the 5th and 9th, three in Llansadwrn. Hawarden had 249.1h and Rostherne 267.8h one of the UK highest. The sunniest day was on the 29th having 15.1h. Solar radiation in Llansadwrn averaged 18.29 MJ m -2, highest 27.91 MJ m -2 on the 23rd and lowest 1.91 MJ m -2 on the thunderstorms day the 27th similar darkness to a day in February. The brightest day was on the 13th with 943 W m -2 and on the 27th light in the morning was 95 W m -2; the afternoon and evening was only 40 W m -2 and 32 W m -2 respectively, all lowest of the month. Rainfall was close to averages the 66.0 mm here (94%) & [106%], largest since 2015 ranking H38, and the total since January 414 mm near the average. The wettest day was on the 27th the result of the thunderstorms when 38.8 mm fell. Days with 5 mm, or more, were down the 3 (-1.5) of average. There were 17 (+5.2) days with no precipitation; 19 (+3.8) dry days; rain days 12 were down (-3.8) as well as wet days 10 (-1.8). Gorwel Heights saw more rain in the month 89.6 mm [147%], the largest fall 35.8 mm on the 27th coupled with 10.8 mm the previous day. Dry days were 18; rain days 13; wet days 9 with 5 having 5 mm, or more. Rainfall duration was 53h while there were 61h in Llansadwrn. Temperatures were not spectacular in comparison of those seen in many southern UK stations during the month exceeding 25C, 28.7C at Northolt on May Day holiday on the 7th when we had 20.1C and Aberdaron 14.1C, Fair Isle had only 8.1C. Highest maxima were 22.1C (-0.6) on the 28th here and 22.6 on the 27th at Gorwel Heights. The mean Llansadwrn temperature was 12.6C (+1.0) & [+0.9] lowest since 2016 station ranking H7 (since 1979). There have been 6 Mays with higher averages notably 2004.
Spring 2016
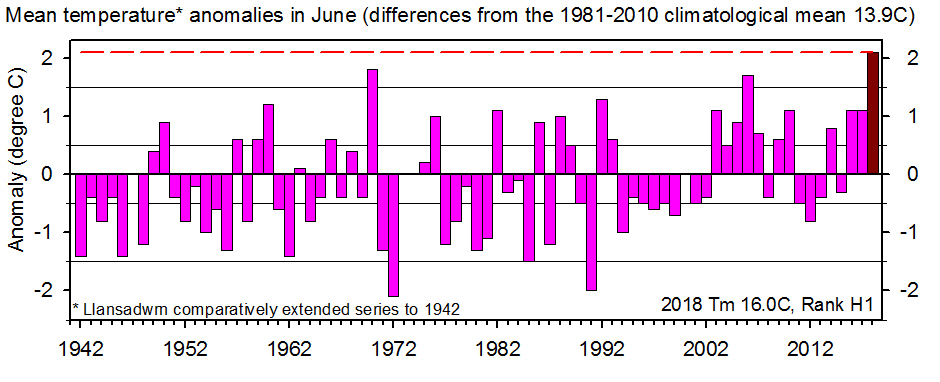
Spring data were all close to the averages. Rainfall most since 2015 and mean temperature lowest since 2016. June 2018Dry, record warmth and record sunshineMainly dry, warm with a few hot days and sunny throughout It was the warmest June on record at this station since before 1979, and by comparison with Valley observations 1942. Rainfall was 21.9 mm (26%) & [32%] of averages, driest since 1988 and 5th lowest in Llansadwrn since 1928. There were 23 (+11.0) days with no precipitation recorded which was also the number of dry days (-7.4). Rain days were just 7 (+7.4); wet days 4 (-7.3). Just 1 day had 5 mm, or more, on the 1st (-4.0) with 11.5 mm. Rainfall at Gorwel Heights was 18.4 mm just [28%] of average. At RAF Valley it was the sunniest June on record with 291.8 h. The previous record was in 2014 that had 263.9 h of sunshine. The sunniest day was on the 28th with 16.1h and there were no sunless days. July 2018A dry, sunny and warm monthWarm even hot at times at the beginning and mostly dryRainfall was 47.2 mm, least since 2006 that had 26.1 mm, (48%) & [68%] of averages and ranking 20th in Llansadwrn records since 1918. Most of the rain 14.4 mm fell on the 28th and there were 14 days (+5.2) with no precipitation recorded. There were 18 (+6.2) dry days having <0.2 mm; 13 (-6.2) rain days those having 0.2 mm, or more; 11 (-3.8) wet days those having 1 mm, or more; and 2 (-4.8) days having 5 mm, or more. Over the 2 months of summer so far 69.1 mm have fallen the 5th lowest in Llansadwrn records. Rainfall duration was 53 (wet hours) and in the summer so far 77 h with the total so the year standing at 526 h some 10% of the time. Rainfall at Valley was 49.6 mm. It was a similar rainfall total at Gorwel Heights the 48.0 mm [82%] of average. The wettest day was on the 28th that also had the highest rate of fall 26 mm/h. Dry days were 18; raindays 13; wet days 11; and there were 3 days with 5 mm, or more. Some very hot weather has been experienced in southern Britain this month with maxima frequently over 30C. Although Porthmadog in Gwynedd claimed several of the hottest we had only 3 hot days in Llansadwrn. The highest maxima were 26.4C on the 8th; 26.0C on the 25th; and 25.2C on the 4th. The mean maximum was 21.4C (+2.2) & [+1.9] of averages highest since 2013 ranking 6th in station records since 1979. The mean minimum was 13.4C (+1.1) & [+1.4] of averages highest since 2006 ranking 4th. The mean was 17.4C (+1.8) & [+1.7] of averages highest since 2013 ranking 5th. At Gorwel Heights the mean temperature was 17.9C [+1.8] of average. The mean maximum was 21.4C and the highest 25.8C was on the 1st of the month. The mean minimum was 14.3C with the lowest 12.1C on the 17th and the highest 18.4C on the 1st. Rainfall duration was 64 h more than in Llansadwrn (53). A sunny month the 256.5 hours of sunshine recorded at RAF Valley the most since 2013 and 4th on the Anglesey record back to 1931 (K&Z corrected data). the sunniest day was on the 3rd with 16.0h.
August 2018A dry month with temperatures near the averages, rather dull at timesSome rain at times through the month, wettest in the middle, with a few sunny days, warmest at the beginning cooling off towards the endA dry month the 62.3 mm of rainfall least since 2010 was (63%) & [72%] of averages. The wettest days were on the 12th with 14.6 mm and the 15th with 9.0 mm . There were 6 days (-1.2) with no precipitation and 13 (+1.3) dry days. Rain days totalled 18 (-1.3); Wet days 15 (+1.2); and 2 days (-3.3) had 5 mm, or more. Rainfall duration was 82 hours with an average rate of fall 0.8 mm per wet hour, the highest recorded rate was 64 mm/h on the 12th (Gorwel Heights on same day 70 mm/h). Rainfall was greater in Llanfairfechan, Gorwel Heights, where 95 mm fell, [112%] of average. The wettest day was on the 12th having 16.4 mm, the 22nd had 14.6 mm and the 10th and 24th each 10.4 mm. Rainfall duration was 71 h with an average rate of fall of 1.3 mm per wet hour. The highest rate recorded was 84 mm/h on the 10th (Llansadwrn on same day 53 mm/h). There were 14 dry days; 17 raindays; 14 wet days; and 7 had 5 mm, or more, compared with the 2 days in Llansadwrn. A somewhat dull month at RAF Valley the 131.8 h of sunshine lowest since 2008. The sunniest day was on the 9th with 12.8h, 3 other days had 10h, or more, but there were unusually 5 sunless days. In Llansadwrn there were 7 sunless days often when the island was enveloped in mist and low cloud. The average global solar radiation was 10.27 MJ m -2 with the brightest 21.78 MJ m -2 on the 9th and the dullest 2.32 MJ m -2 on the 15th. The brightest hour in the month was also on the 9th with 673 W m -2 recorded between 11 and 12 GMT compared with the 15th when only 37 W m -2 was recorded. The brightest on that day was only 45 W m -2 between 13 and 14 GMT comparable to a day in January. Summer 2018Much drier and warmer than averages. Summer sunshine at RAF Valley totalled 688.9h the most since 2014 (698.9 h) and with 2013 (699.5h) making it the 3rd sunniest on the Anglesey record since 1931 (Kipp & Zonen corrected data).
Monthly data 2018
Llanfairfechan, Gorwel Heights observations
AcknowledgementsThe Met Office at RAF Valley kindly supplied observational data from 1942 to 2011. Current data (provisional) are gathered from SYNOP reports and METAR. I am grateful to David Lee for use of data from his weather station at Gorddinog.
| |||||||||||||||||||||||||||||||||||||||||||||||||||||||||||||||||||||||||||||||||||||||||||||||||||||||||||||||||||||||||||||||||||||||||||||||||||||||||||||||||||||||||||||||||||||||||||||||||||||||||||||||||||||||||||||||||||||||||||||||||||||||||||||||||||||||||||||||||||||||||||||||||||||||||||||||||||||||||||||||||||||||||||||||||||||||||||||||||||||||||||||||||||||||||||||||||||||||||||||||||||||||||||||||||||||||||||||||||||||||||||||||||||||||||||||||||||||||||||||||||||||||||||||||||||||||||||||||||||||||||||||||||||||||||||||||||||||||||||||||||||||||||||||||||||||||||||||||||||||||||||||||||||||||||||||||||||||||||||||||||||||||||||||||||||||||||||||||||||||||||||||||||||||||||||||||||||||||||||||||||||||||||||||||||||||||||||||||||||||||||||||||||||||||||||||||||||||||||||||||||||||||||||||||||||||||||||||||||||||||||||||||||||||||||||||||||||||||||||||||||||||||||||||||||||||||||||||||||||||||||||||||||||||||||||||||||||||||||||||||||||||||||||||||||||||||||||||||||||||||


