Llansadwrn (Ynys Môn) Weather Station
The Great UK Weather Watch Day
Observations on 17 March 2004

Llansadwrn (Ynys Môn) Weather Station
|

|
An UK Weather Observation Day was held on Wednesday 17 March 2004 during the British Associationís National Science Week. Schools and individuals in the UK were invited to take part, observe the weather two or three times and enter their observations in the database of the MetLinkInternational Project. HMS Endurance, on duty near South Georgia in the South Atlantic, also took part this year. The MetLinkInternational project, the flagship weather project of the Royal Meteorological Society, has been running for 6 years. At first it was for schools in the UK but is now worldwide.
OBSERVATION HOURS
On this page I am using the observations to illustrate changing weather throughout the day. I made observations at 0600, 0900, 1200, 1500, 1800 and 2100 GMT. But firstly, a point about how important it is to keep to accepted observation times if your data is to be comparable with others. Observations at this weather station conform with those made at a climatological station. This means that observations are made close to 0900 GMT and can refer to the past 24-h. This convention has been adopted, and been in use for many years, to enable comparison to be made between stations all over the UK. It can be confusing until the main points are understood. Some observations do refer to 0900 GMT on the day (date). These include barometric pressure, current temperature and relative humidity, visibility, cloud types and present weather. Others refer to the past 24-h and include amount of rainfall, maximum and minimum temperature. While the minimum temperatures (air and grass) are given the current date, the 17th March in this case, the maximum temperature and rainfall are 'thrown back' to the previous day - the 16th March. The observations that you see recorded on the 'observation pages' of this website conform to this rule. At 0900 GMT all instruments are reset. Some stations record at additional hours as well. The most common is 2100 GMT when maximum and minimum temperatures are read, the thermometers reset, and rainfall measured. Others, mainly traditional 'resorts' make observations at 1800 GMT, it is these that are reported in newspapers and on BBC Ceefax. Some stations, those whose observations are used for synoptic purposes, may record every 3 h through the day and sometimes night. Weather stations at airports record and report every hour, but even at these their observations can be compiled into the standard 24-h 09 - 09 GMT day.
SYNOPTIC ANALYSIS
![]() On the 17th March there was a low (972 mb) near the Faeroe Islands, to the north of Scotland, while high (1036 mb) was near north Italy with another (1031 mb) lying in the Atlantic to the SW of the UK. A frontal system was moving SE across the UK.
On the 17th March there was a low (972 mb) near the Faeroe Islands, to the north of Scotland, while high (1036 mb) was near north Italy with another (1031 mb) lying in the Atlantic to the SW of the UK. A frontal system was moving SE across the UK.
OBSERVATIONS
At 1800 GMT on the previous day, 16th March, pressure at the weather station was 1016 mb. The temperature was 11.5C having returned to the maximum of already seen at noon. The minimum thermometer was still showing the temperature at 0900 GMT. There was no rainfall in the raingauge. At 0600 GMT on the 17th the temperature was 7.4C, but the minimum thermometer was on 6.9C; it was misty in low cloud and the relative humidity was 100%. It had rained overnight and 3.2 mm was measured, but was returned to the raingauge. Pressure was 1020 mb and the SW'ly wind was blowing at 9.0 kph. At 0900 GMT, the usual observation hour, the temperature had risen to 8.1C and the relative humidity was 97%. The maximum thermometer was reading 11.5C and the minimum 6.9C, both were reset to the current temperature as it was the end of the 24-h period. Rainfall was measured and had not changed from the previous 3.2 mm, so there had been no measurable precipitation in the last 3 h. This time the water was thrown away as it was the end of the 24-h period. Pressure was rising and was 1022 mb; the wind was SW'ly with a speed 16 kph. Observations were repeated at the hours already stated.
Pressure rose further to 1026 mb at 1200 GMT then remained steady through the day to 1800 GMT . At 2100 GMT pressure was just starting to fall. By the next morning at 0900 GMT, on the 18th it had fallen to 1015 mb.
Weather and clouds
 |
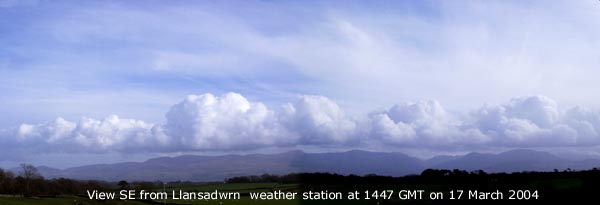
On the evening of the 16th March a weak cold front encroached from the NW and there was light rain from 1930 to 2200 GMT. Low cloud and mist persisted until the following morning. At 0800 GMT observations reported stratus cloud with visibility <1 km. There were signs that the cloud and mist was beginning to lift and thin. At 0900 GMT the sky was starting to clear with 6/8 cover of altocumulus, cirrostratus and stratocumulus. Visibility had improved to >10 km but mist and low cloud were still hanging over the Snowdonia Mountains. The frontal cloud was to make only slow progress SE during the day, but by 1200 GMT it had become mostly sunny. Although cloud cover was 5/8 the sun was shining through a patch of thin cirrostratus. A solar halo was observed at this time. A line of stratocumulus clouds was developing over the mountains to the S and SE of the weather station and a few cumulus clouds were passing in the vicinity. Low in the sky to the N, over looking Liverpool Bay, retreating stratus (or possibly sea fog) could be seen. It was warmest around 1400 GMT and the linear stratocumulus clouds over Snowdonia are seen clearly on the NOAA 16 satellite image at 1404 GMT. At 1500 GMT cloud cover was still 5/8 with the line of stratocumulus clouds persisting and further developed (see image above). The sky was clearer to the N with haze on the horizon. Around 1700 GMT the sky started to clear and by 1800 GMT cover was down to 2/8. The stratocumulus over the mountains had decayed and by 2100 the sky was clear 0/8.
![]() Sequence of photographs taken through the day from 0900 to 1800 GMT.
Sequence of photographs taken through the day from 0900 to 1800 GMT.
Temperature, relative humidity and wind speed
 Fig. 1 shows the air temperature and relative humidity within a Stevenson screen, and wind speed measurements. The temperature rose to 11.5C by 1200 GMT, and humidity fell to 78% at 1500 GMT. But the temperature shown by the maximum thermometer read at 1500 GMT was 12.5C, this occurred about 1400 GMT as shown on the thermograph trace. Thereafter the temperature began to fall to 7.5C and humidity to rise to 93% by 2100 GMT. It was noted that the minimum was reading just 0.1C lower, it having been a bit colder just before the readings were taken. At 0900 GMT the following day, the 18th, the current temperature was 6.6C and relative humidity 83%. The maximum thermometer was still reading 12.5C, the maximum of the past 24-h, this was credited to the 17th. The minimum thermometer read 6.0C, the minimum of the past 24-h, but was credited to the 18th. The grass minimum thermometer was showing 4.5C, this reading was also credited to the 18th. All 3 thermometers were reset.
The wind kept SW'ly through the day but it's speed increased reaching 22 kph at 1200 GMT. Thereafter it fell away to 9 kph by 2100 GMT.
Temperature of the soil, but first something about soil thermometers
Soil thermometers are mercury in glass with bent stems. The bulbs are just like a standard dry bulb thermometer but bent at right angles at 5, 10 and 20 cm. They are kept under bare soil. The earth thermometers are kept under grass and are not bent; they are housed in glass tubes with the bulbs embedded in wax. The thermometer, in its glass tube is attached to a length of chain, and inserted into metal tubes sunk in the earth to the required depth of 30, 50 and 100 cm. They are extracted from the metal tubes to make the reading which needs to be done as quickly as possible. This is because the temperature at depth will most likely be quite different to the air temperature, and soon change. Being embedded in wax, however, minimises this change.

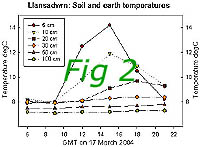
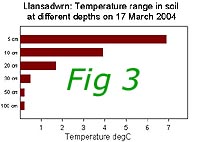
 Soil and earth temperatures are usually read only at 0900 GMT, but at crop weather stations at 1500 GMT as well. On this day they were read on every occasion and this allows variation through the day to be examined (Fig. 2). Temperatures near the surface (5, 10 and 20 cm depths under bare soil) showed the greatest variation. At 5 and 10 cm the temperature rose from 7.9C and 8.2C to 14.2C and 11.9C respectively at 1500 GMT. At 20 cm starting from 8.1C at 06 GMT it rose to 9.7C at 1800 GMT. This shows that it would be necessary to make observations through the day to catch the highest. Also the maximums occur after the air temperature, and the deeper in the soil the later is the maximum. All because it takes longer for the warmth to penetrate into the soil. The temperature at 50 and 100 cm hardly changed. At 30 cm the temperature was 7.9C at 0900 GMT and this rose to 8.4C at 2100 GMT. The daily ranges were; 5 cm 6.9C, 10 cm 3.9, 20 cm 1.7C, 30 cm 0.5C, 50 cm 0.2C, and 100 cm 0.2C (Fig. 4). If a station has only 1 soil or earth thermometer it is usually kept at 30 cm under grass. It is usually kept in a metal tube, but sometimes the more fragile bent stem type is used in which case it may be kept under bare soil. The temperature at 30 cm is most closely correlated with plant growth. Temperatures throughout the day could be used to investigate the thermal properties of different soil types. I'm sometimes asked if temperatures are different under grass and bare soil? The answer is yes. Grass can act as a blanket over the soil; when cooling the grass blanket keeps the underlying soil warm. When warming the reverse is true, it keeps the underlying soil cool. I have kept thermometers at 20 cm under soil and grass for a while. The differences are usually but not always small; on the 17th the under bare soil thermometer was +0.2C (warmer), perhaps I will write a page about the differences one day!
Potential evapotranspiration
 Evaporation can be measured by a number of methods that include the evaporation pan, the Piché evaporimeter tube and lysimeter. All are old, classical methods. The more modern way is to use mathematical equations to calculate evaporation using frequent measurements of temperature, wind speed, solar radiation. This has been made much easier with the establishment of accurate and reliable automatic weather stations, and computers, but is only done at a small number of weather stations. Measuring evaporation by lysimeter, however, still has its uses particularly in arid regions of the world. Lysimeters, and modern adaptations, are also used to explore the input and output of geochemicals and are useful when investigating nutrient dynamics of ecosystems.
For today the lysimeter can be thought of as an integrating instrument; air and soil temperatures, wind speed and solar radiation are all involved in evaporation. A lysimeter is a tank which can be small or large, containing moist soil and covered with vegetation, usually grass. Input (rainfall) and output (drainage) of water is measured in mm and the net difference calculated. When input exceeds output evaporation has taken place. Used in this way the result is called potential evapotranspiration (PE). I describe in these web pages how to make and use a lysimeter (see references). But the type I used for these observations is a bit different; it is smaller so that it can be weighed on an accurate balance. But the principles are the same.
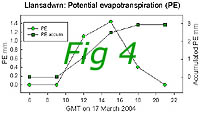
There was no evaporation between 06 GMT and 09 GMT when it was cool and humid (Fig. 3). Between 0900 and 1200 GMT when the sun was up, the temperature and wind speed were rising, there was PE of 1.1 mm. (At 1400 GMT the temperature on the soil surface just under the grass was 15.1C). Between 1200 and 1500 GMT PE was 1.4 mm and between 1500 and 1800 GMT 0.4 mm. (At 1800 GMT the temperature on the soil surface just under the grass was 7.4C). There was no evaporation between 1800 and 2100 GMT, when it was again cool and humid with reduced wind speed. Over the day there was a total 2.9 mm of PE. As there was no rainfall the balance of water in the soil was reduced by this amount.
 The shape of the PE curve in Fig. 4 closely follows the temperature of the air, soil near the surface and wind speed (variables). Analysis of correlation coefficients showed that PE was positively correlated with air temperature (r=0.98), temperature of soil at 5 cm (r=0.99), wind speed (r=0.79). It was negatively correlated with relative humidity (r=-0.93). To illustrate interrelationships of these variables (Fig. 5) I have plotted PE against soil temperature at 5 cm, wind speed and relative humidity. Also shown are calculated linear regression lines. This simple treatment of the results shows how the lysimeter is such a good integrator of the observations made during the day.
REFERENCES
BURTON, B. (2004) HRPT Satellite Images (http://www.btinternet.com/~wokingham.weather/wwp.html) Images
METEOROLOGICAL OFFICE UK (2004). (http://www.metoffice.com/index.html) Surface analysis charts, 6-hourly are available on the Internet courtesy of Georg Müller at TopKarten (http://www.wetterzentrale.de/).
TopKarten
METLINKINTERNATIONAL WEATHER PROJECT. (http://metlink.org/index.php) Flagship Weather Project of the Royal Meteorological Society. MetLink
NOAA (US National Oceanic and Atmospheric Administration/ Department of Commerce) (http://www.noaa.gov/) Satellite images NOAA
PERKINS, D. F. (1996).The lysimeter: A robust alternative apparatus to the Piche evaporimeter. Bulletin, Climatological Observers Link., 317, 42-45
_____________ (2001). Lysimeter PE. Bulletin, Climatological Observers Link., 371, 41.
_____________ (1999). Use and construction of a lysimeter to measure evapotranspiration. (http://www.llansadwrn-wx.co.uk/lysim.html) Lysimeter
These pages are designed and written by Donald Perkins, Copyright © 1998 - 2004Document dated 30 March 2004http://www.llansadwrn-wx.co.uk |